📊 SaaS Landing Pages: Visual Attention Analysis
Analysis of 48 top SaaS landing pages using RealEye Attention Predictor — 1920×1080 above-the-fold viewport
📈 Key Metrics (Industry Averages)
🎯 Attention Distribution by Element
Based on heatmap analysis across all 48 landing pages, here's how visual attention distributes across main page elements:
Hero Headline
Product Visual
CTA Button
Social Proof
Features
🏆 Top 10 Landing Pages by First-Glance Attention
| Rank | Company | VAI (3s) | Reach | Hold | Speed |
|---|---|---|---|---|---|
| 1 | Wistia | 0.1784 | 0.1864 | 0.1715 | 0.1772 |
| 2 | Airtable | 0.1748 | 0.1907 | 0.1654 | 0.1685 |
| 3 | Slack | 0.1705 | 0.1809 | 0.1675 | 0.1632 |
| 4 | Webflow | 0.1685 | 0.1805 | 0.1589 | 0.1661 |
| 5 | Gong | 0.1654 | 0.1775 | 0.1589 | 0.1599 |
| 6 | Figma | 0.1652 | 0.1758 | 0.1586 | 0.1612 |
| 7 | Intercom | 0.1649 | 0.1743 | 0.1588 | 0.1615 |
| 8 | Canva | 0.1635 | 0.1791 | 0.1574 | 0.1540 |
| 9 | HubSpot | 0.1614 | 0.1754 | 0.1498 | 0.1592 |
| 10 | HubSpot_CRM | 0.1606 | 0.1740 | 0.1514 | 0.1563 |
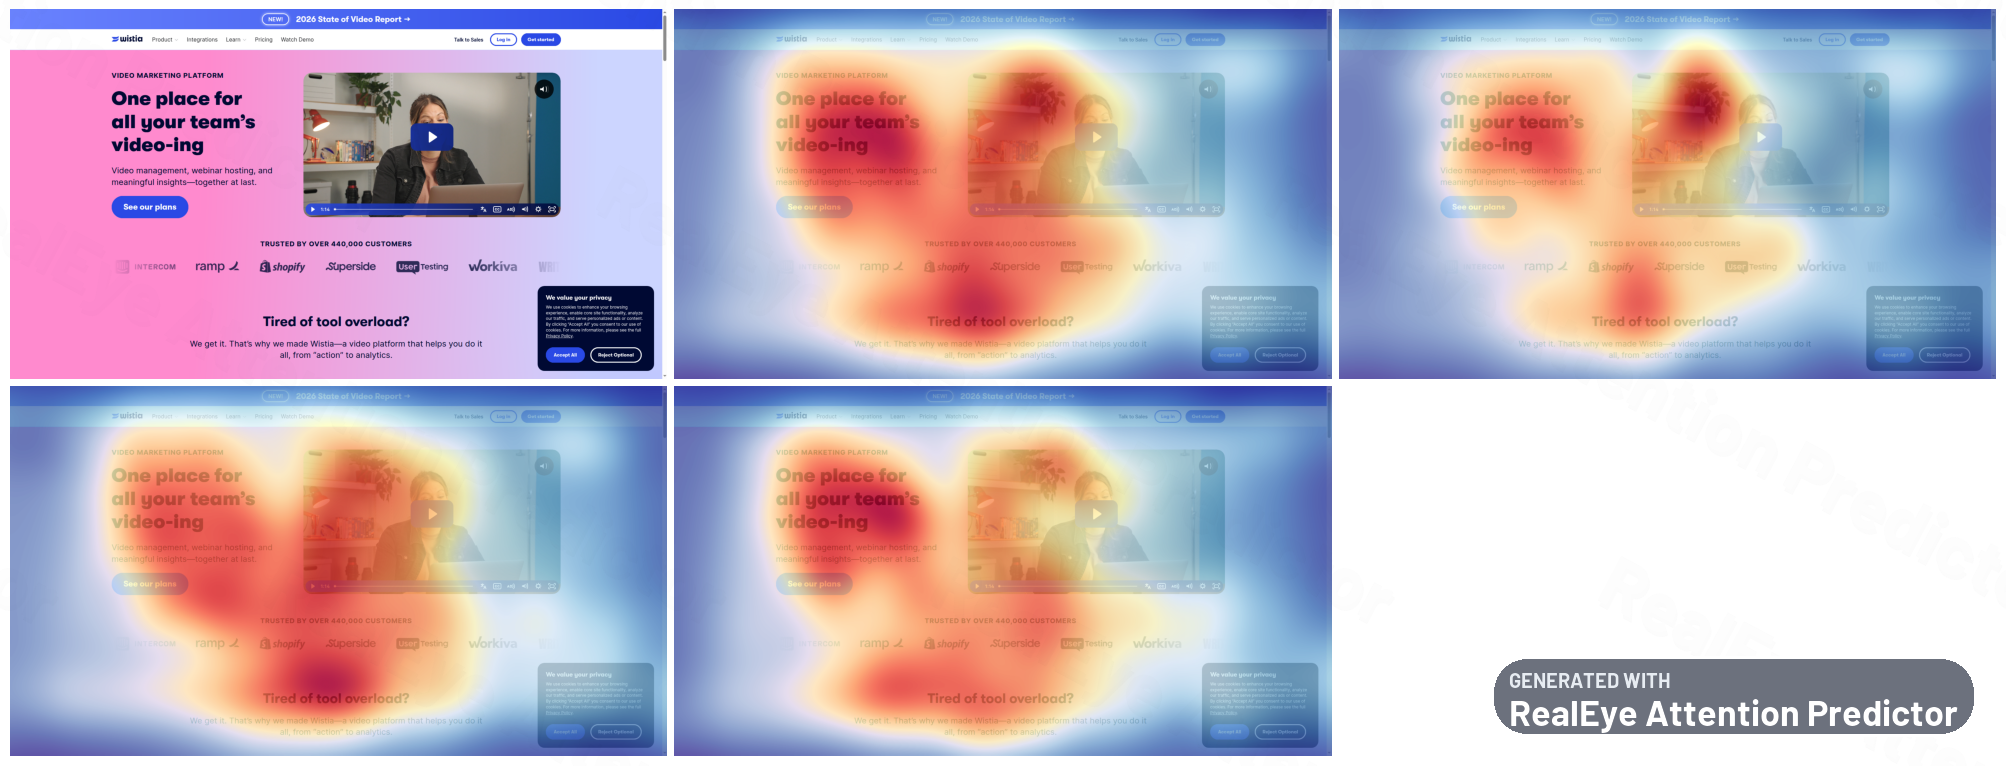
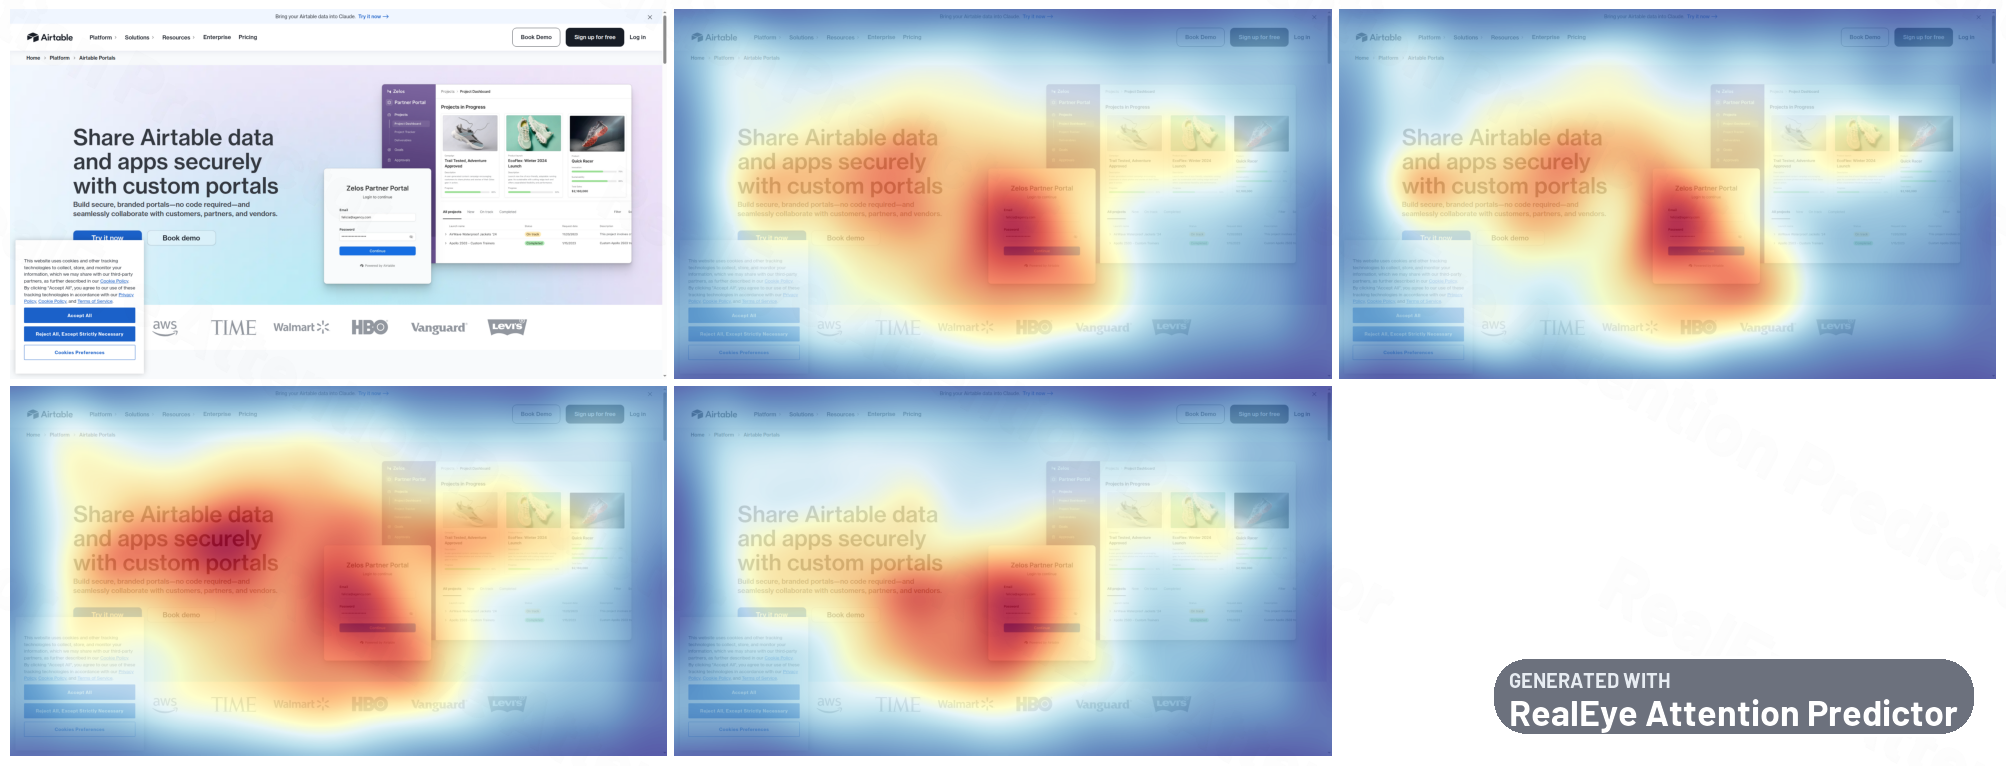
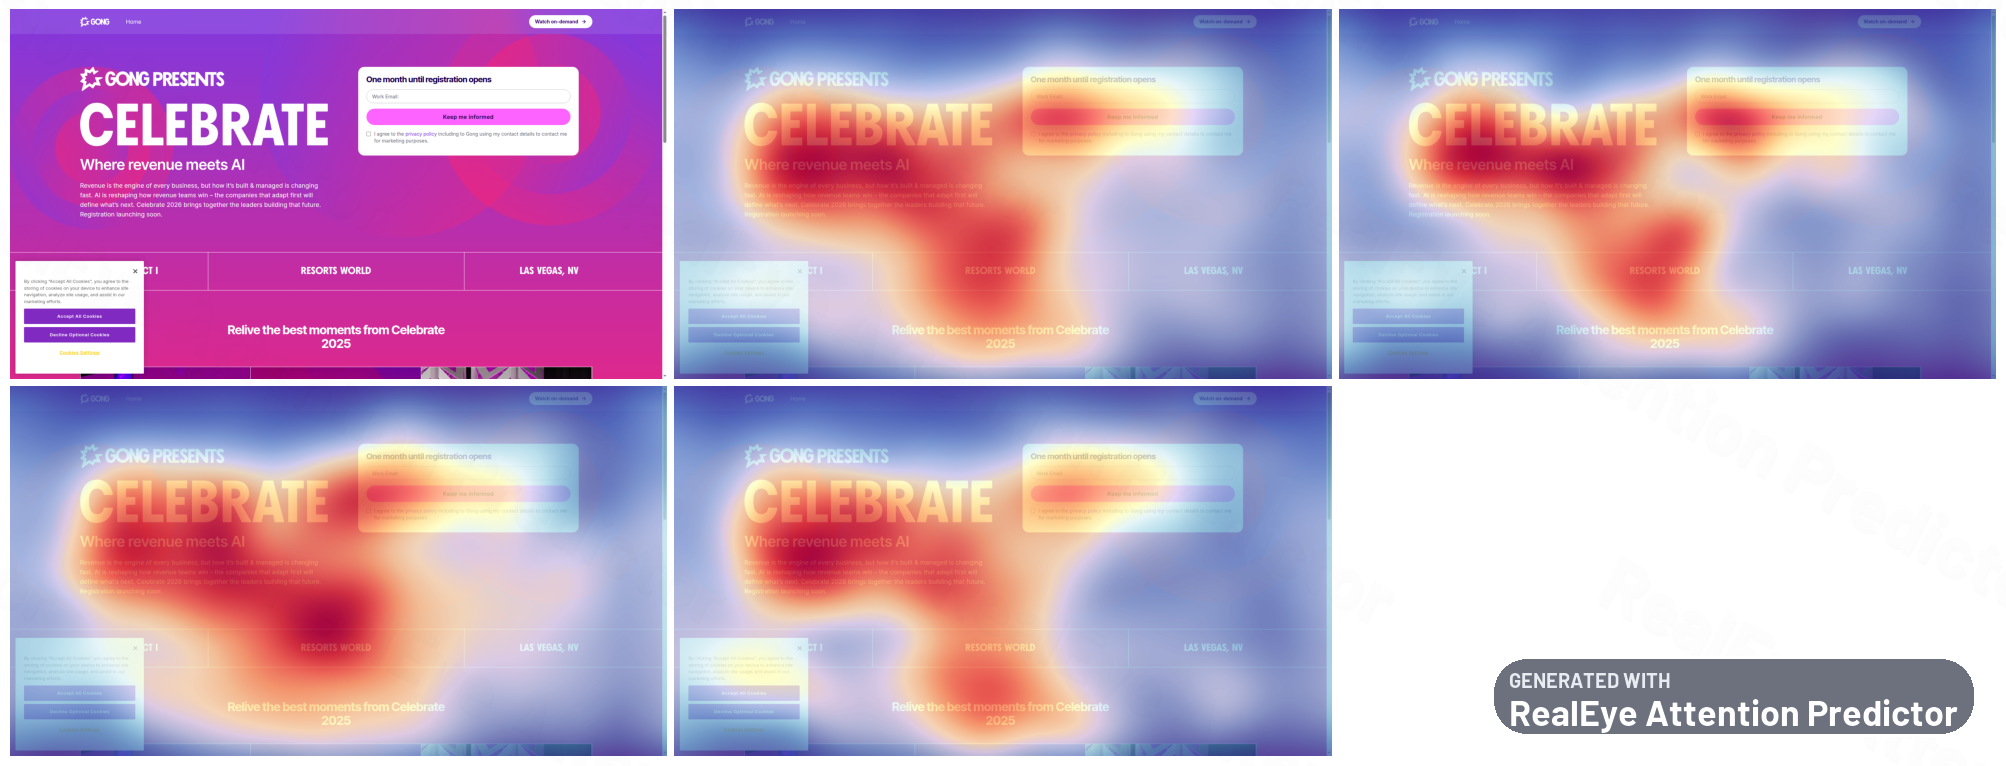
🔥 Top 5 Heatmaps
Visual attention heatmaps showing where eyes are predicted to look (red = high attention, blue = low):
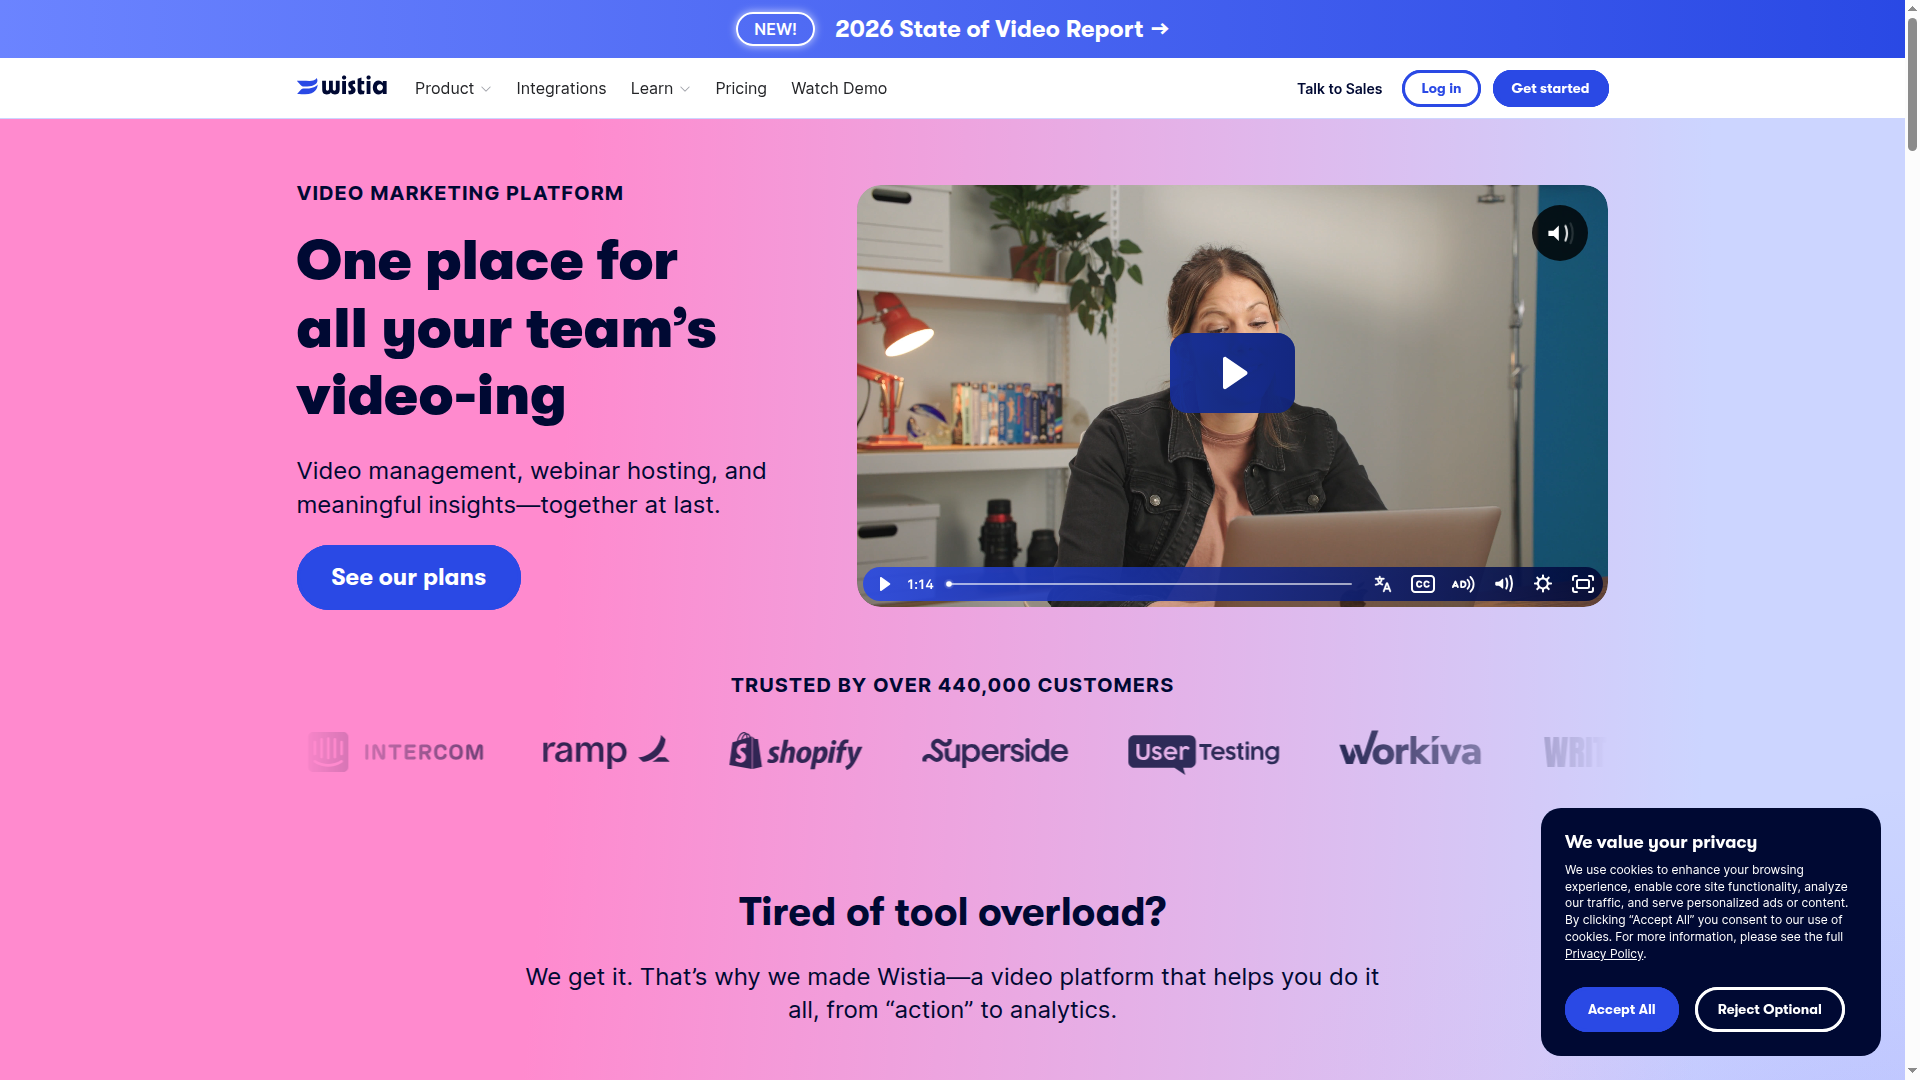
Wistia (VAI: 0.1784)
Rank #1 — First-glance attention
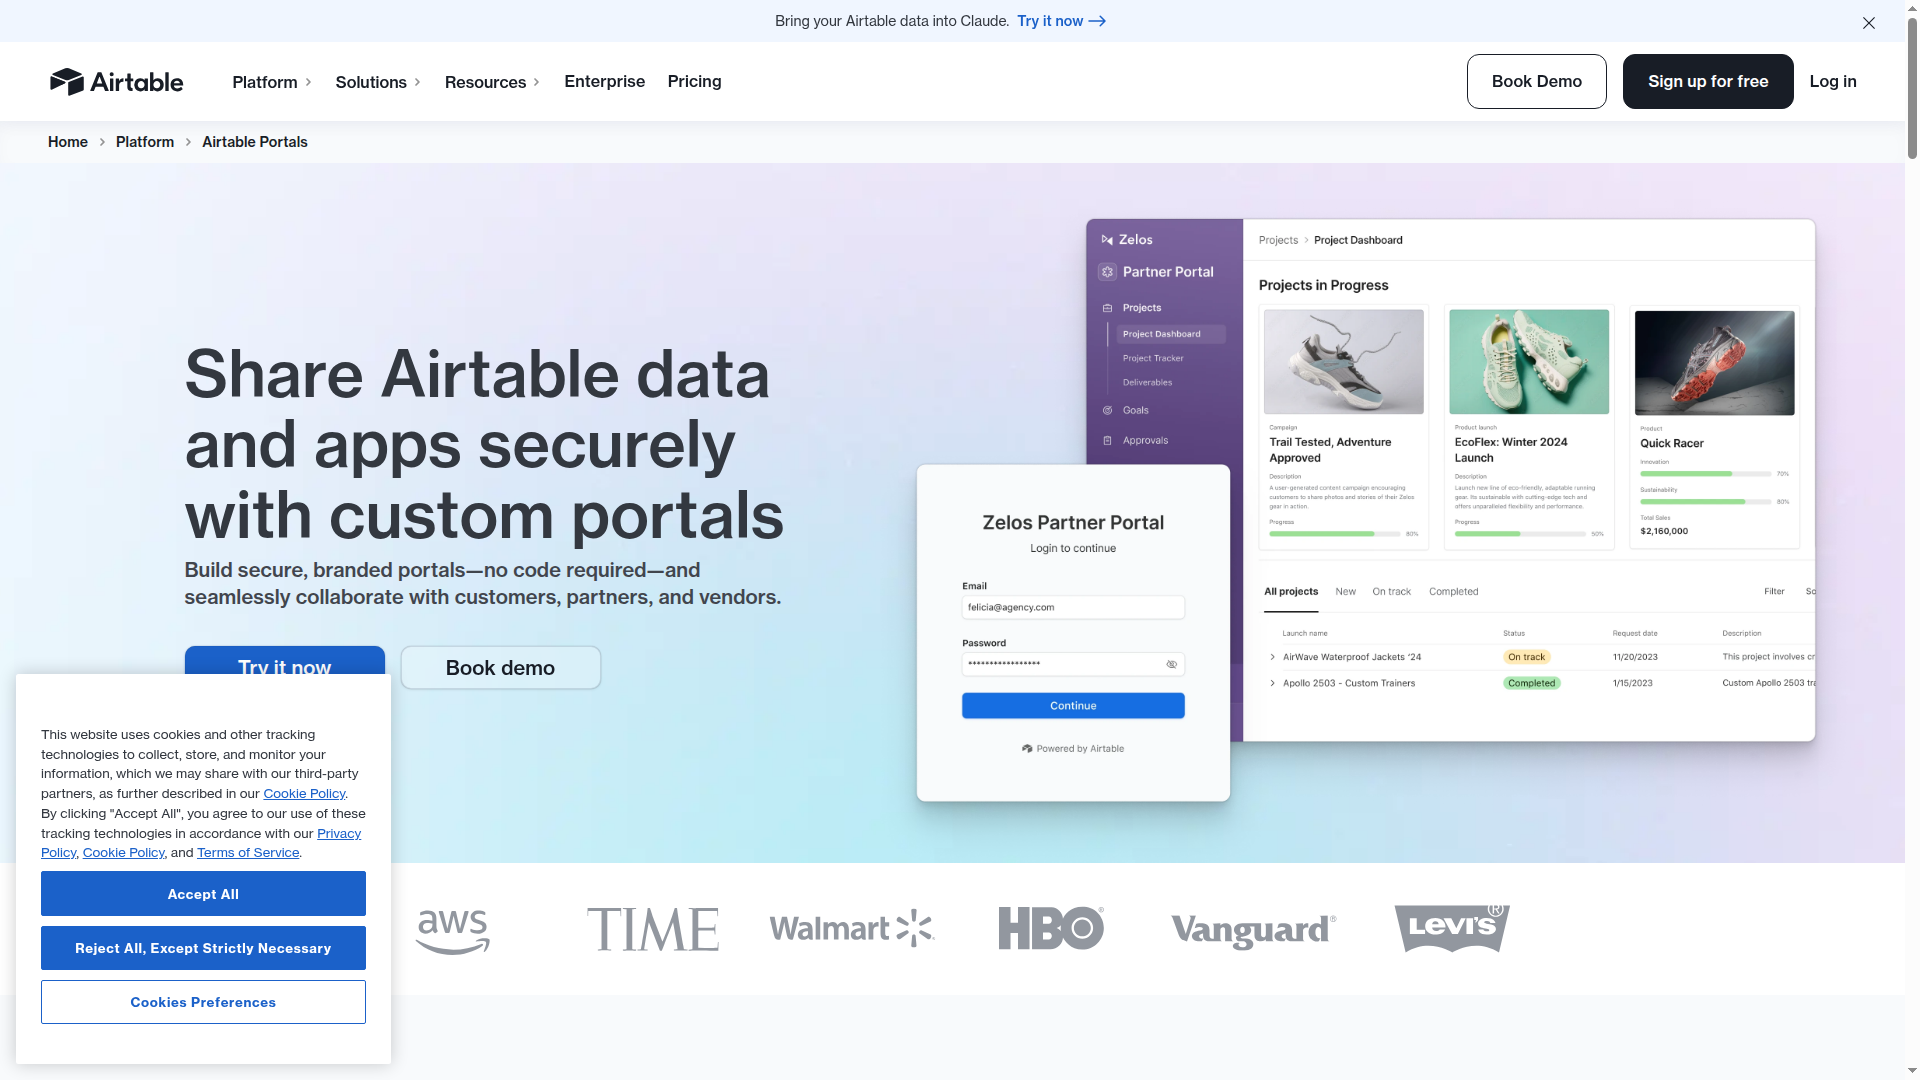
Airtable (VAI: 0.1748)
Rank #2 — First-glance attention
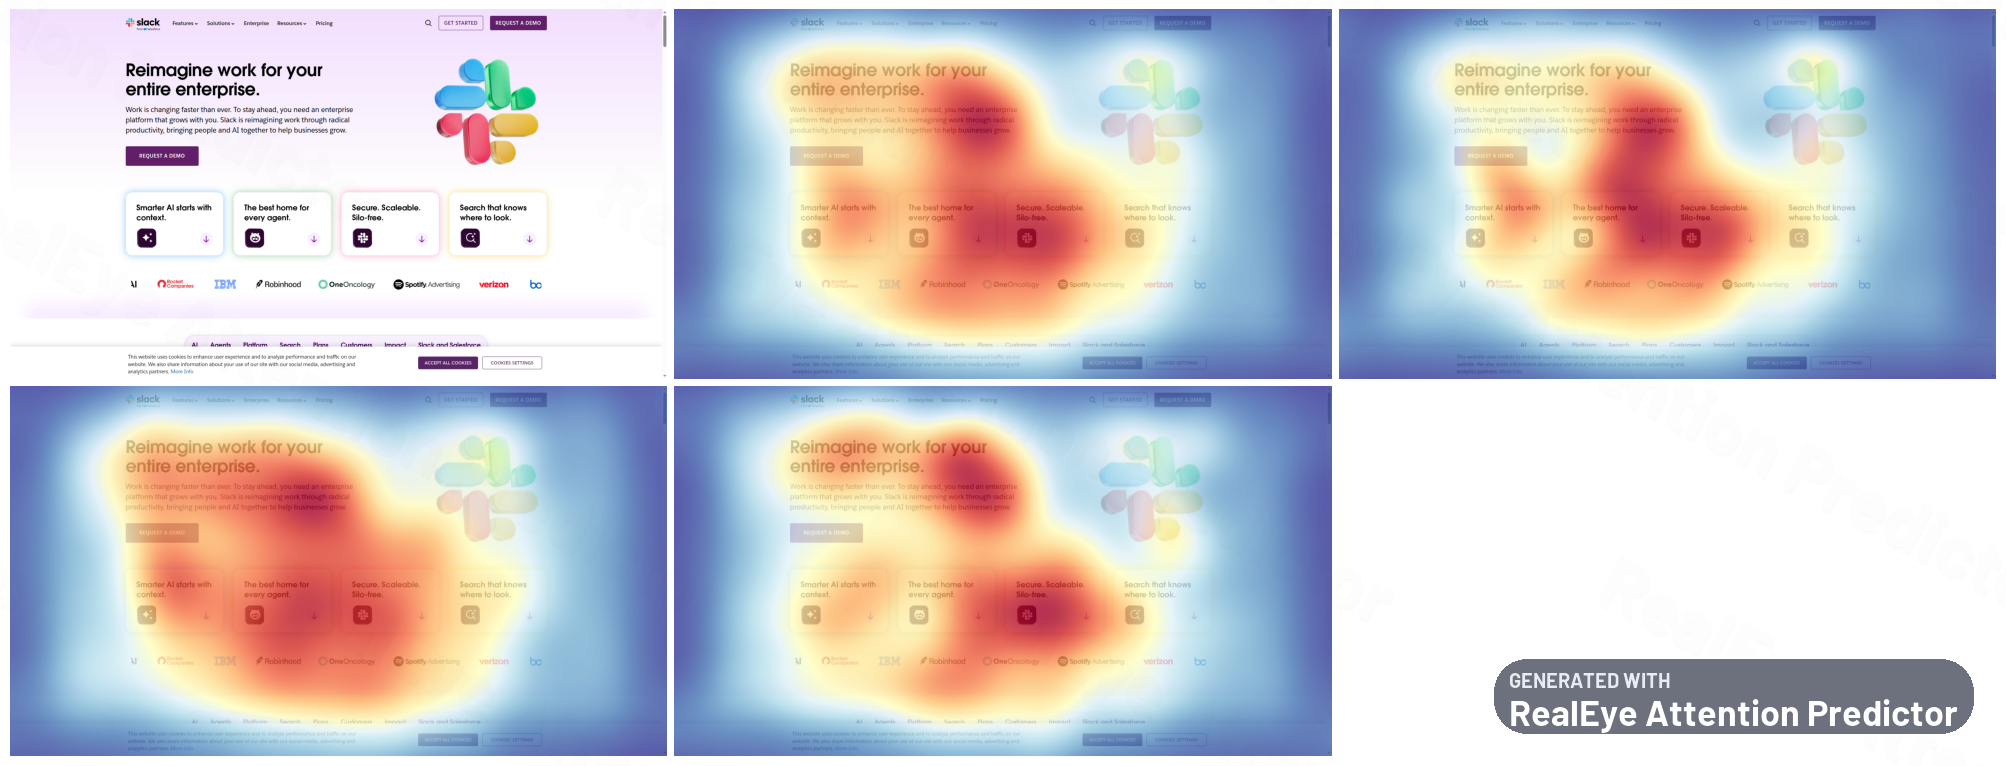
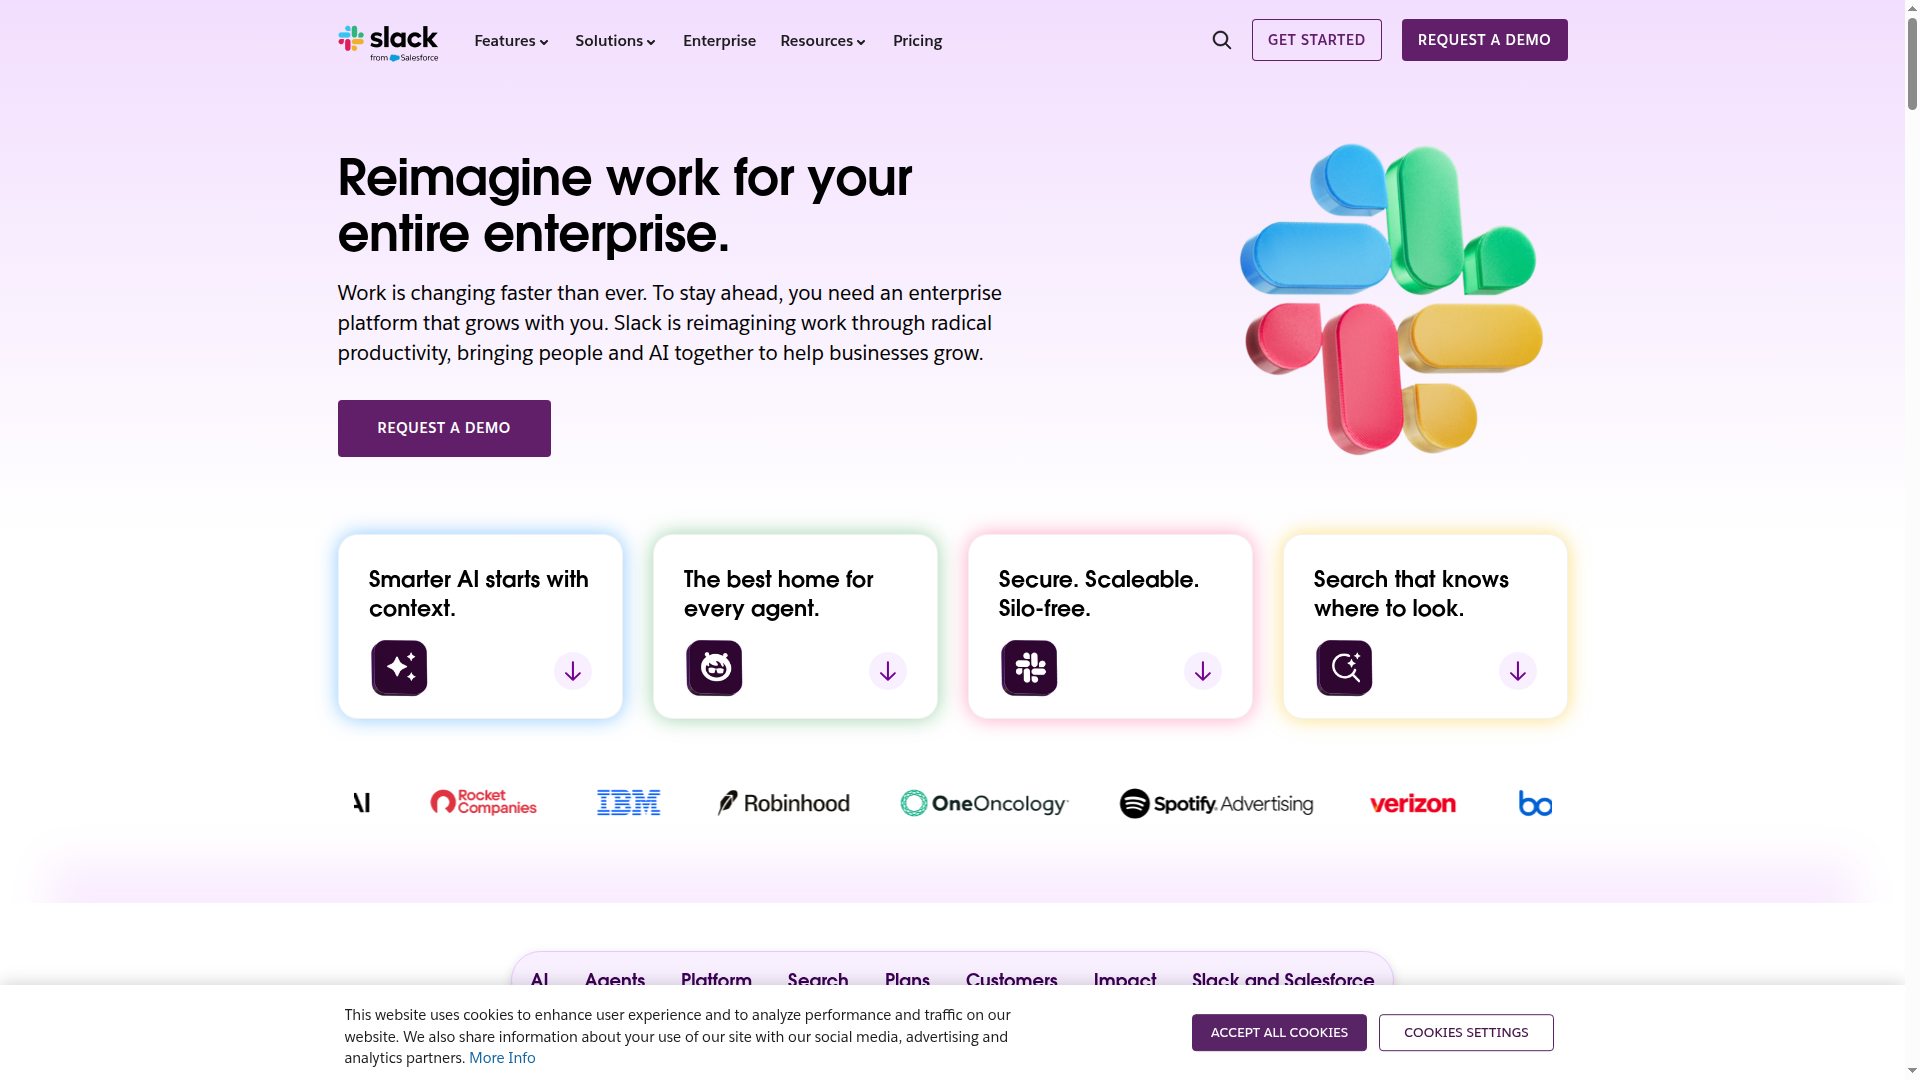
Slack (VAI: 0.1705)
Rank #3 — First-glance attention
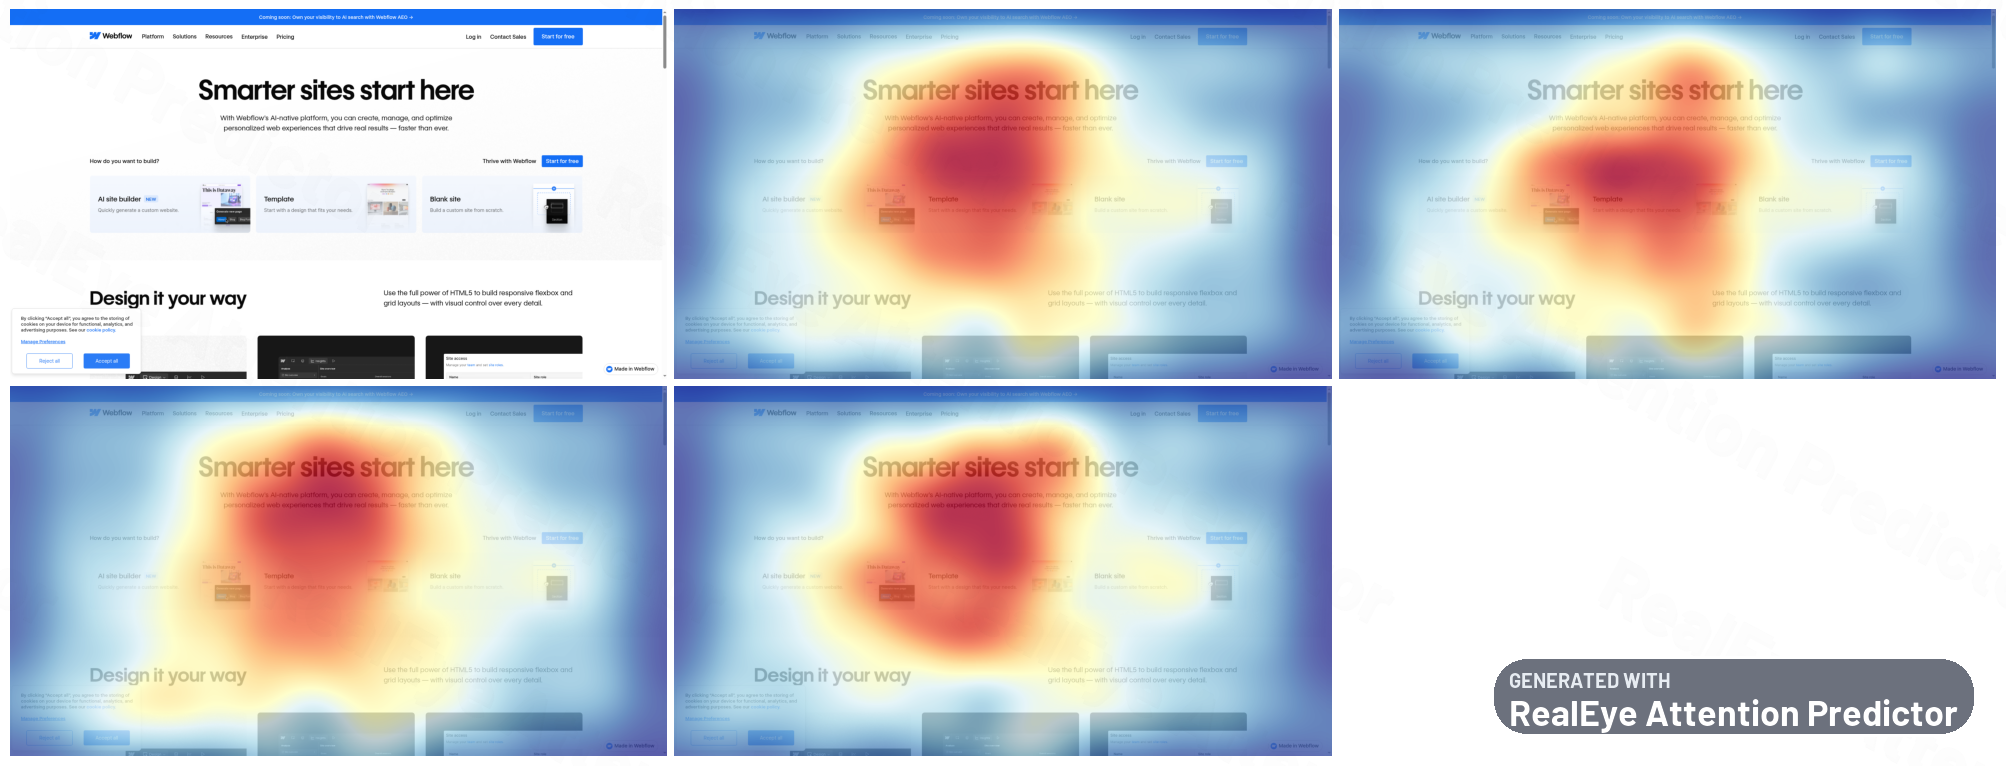
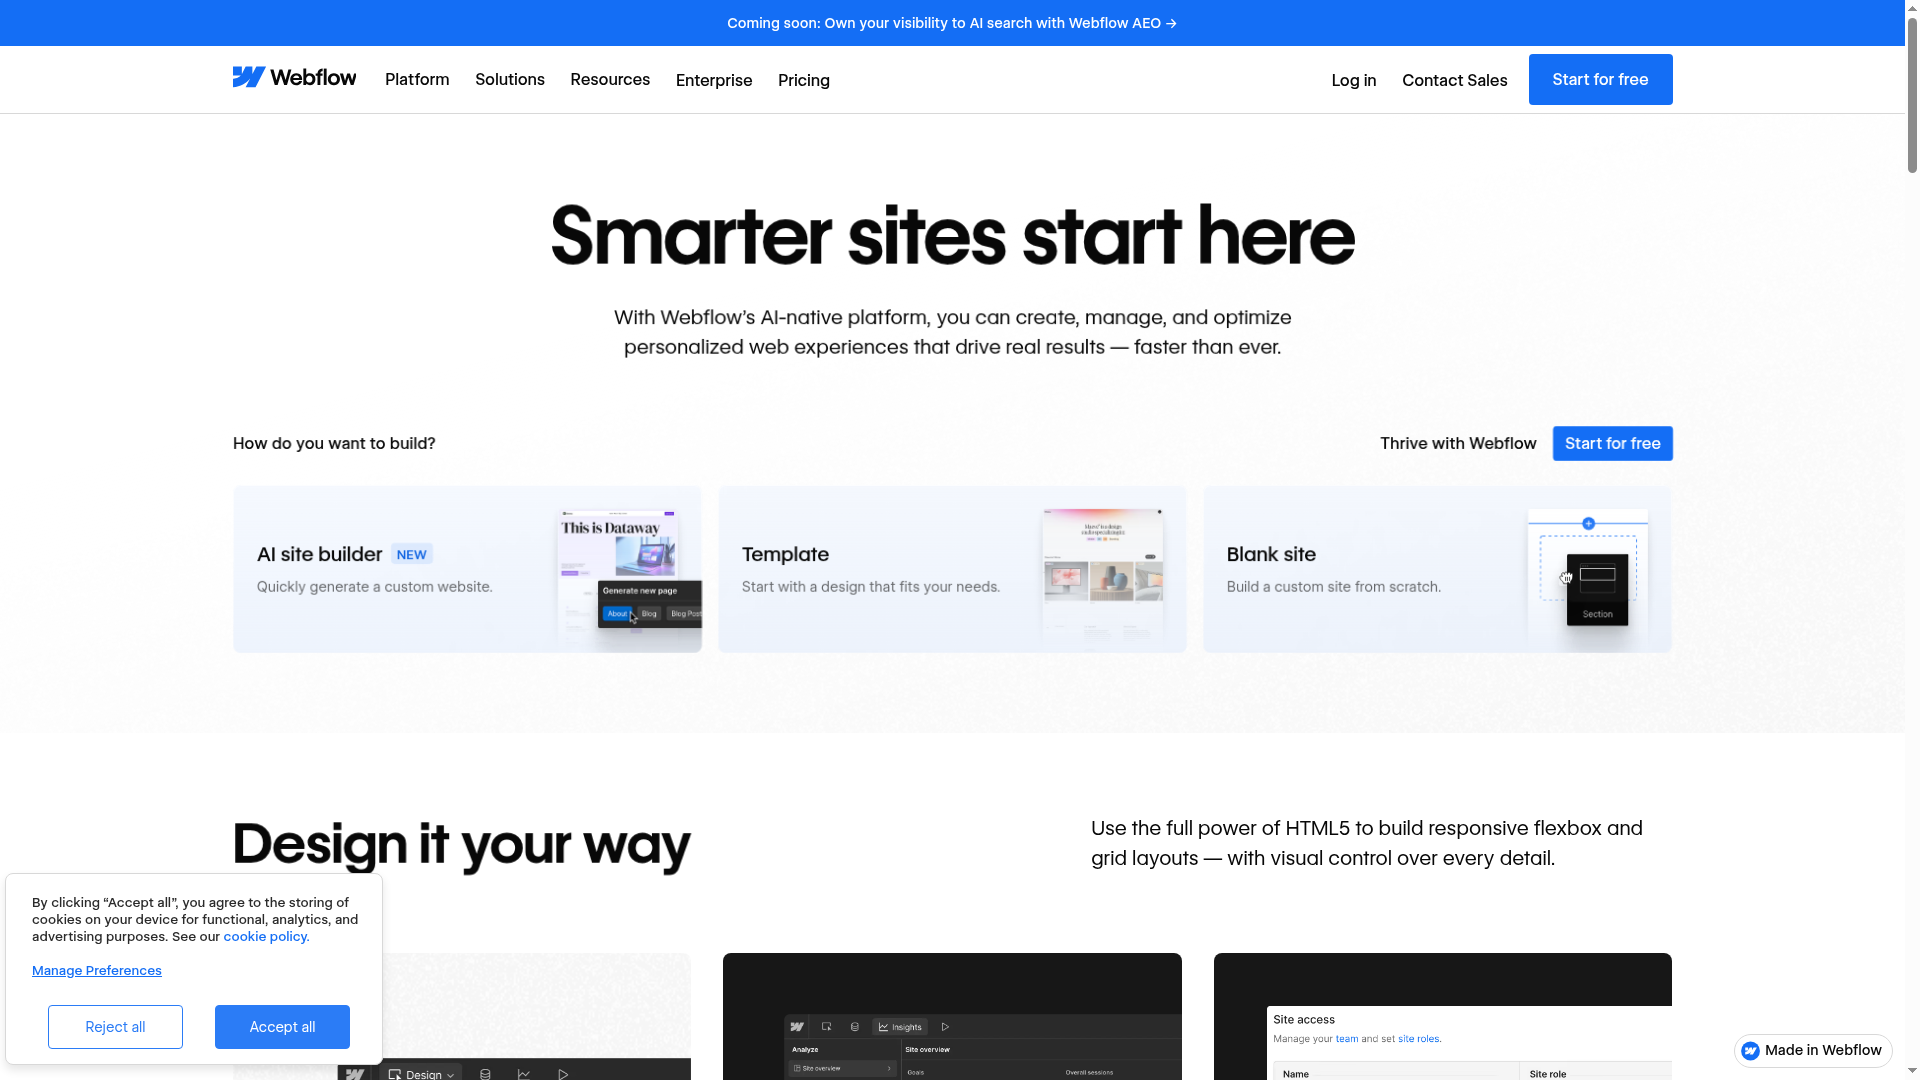
Webflow (VAI: 0.1685)
Rank #4 — First-glance attention
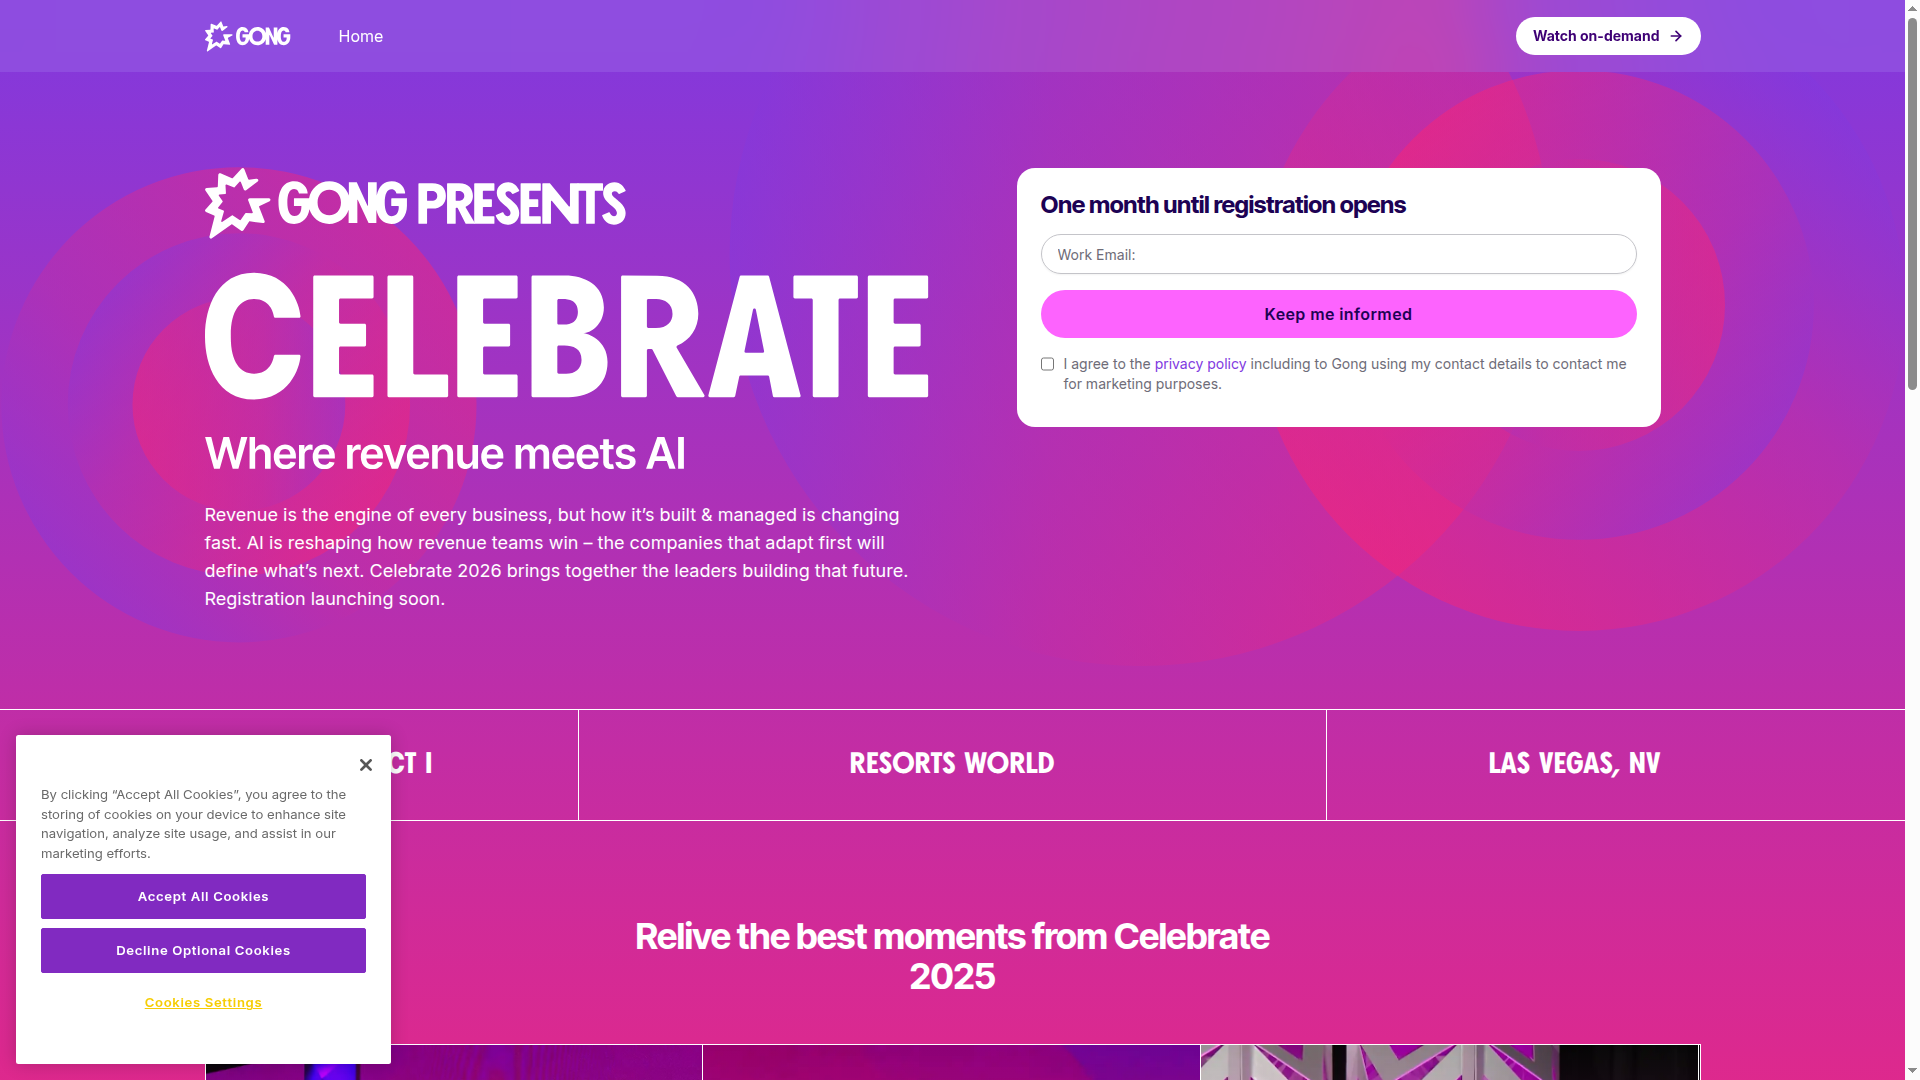
Gong (VAI: 0.1654)
Rank #5 — First-glance attention
🎨 Design Recommendations
Based on attention analysis of top-performing SaaS landing pages, here are actionable recommendations for each page element:
Hero Headline — 32% of attention
- Keep it under 8 words for maximum impact
- Use 48-72px font size for desktop
- High contrast: dark text on light background or vice versa
- Position in top-left quadrant (natural reading start)
- Focus on benefit, not features ('Save 10hrs/week' vs 'AI-powered analytics')
Product Visual — 28% of attention
- Show actual product interface, not stock photos
- Use bright, colorful screenshots for visual pop
- Position on right side (balanced with left-aligned text)
- Add subtle annotations/arrows to highlight key features
- Consider animated GIFs or short videos for higher engagement
CTA Button — 18% of attention
- Use contrasting color (not matching background)
- Clear action-oriented text ('Start free', 'Get demo')
- Minimum 44px height for touch targets
- Place within 200px of headline for visual connection
- Add subtle shadow or border for depth
Social Proof — 12% of attention
- Use recognizable customer logos (not unknown startups)
- Include specific metrics ('50,000+ users' not 'many users')
- Place below hero but above the fold
- Keep it clean — 4-6 logos max, monochrome for subtlety
- Add trust badges (SOC2, GDPR, etc.) for enterprise
Features — 10% of attention
- Use 3-4 key features max (cognitive load)
- Pair each feature with a visual/icon
- Focus on benefits, not just features
- Use consistent card/grid layout for scanability
- Add micro-animations on scroll for engagement
📊 Complete Rankings
| Rank | Company | VAI (3s) | VAI (6s) | VAI (10s) | Reach | Hold | Speed |
|---|---|---|---|---|---|---|---|
| 1 | Wistia | 0.1784 | 0.1999 | 0.2142 | 0.1864 | 0.1715 | 0.1772 |
| 2 | Airtable | 0.1748 | 0.1922 | 0.2045 | 0.1907 | 0.1654 | 0.1685 |
| 3 | Slack | 0.1705 | 0.1899 | 0.2028 | 0.1809 | 0.1675 | 0.1632 |
| 4 | Webflow | 0.1685 | 0.1827 | 0.1934 | 0.1805 | 0.1589 | 0.1661 |
| 5 | Gong | 0.1654 | 0.1863 | 0.2003 | 0.1775 | 0.1589 | 0.1599 |
| 6 | Figma | 0.1652 | 0.1876 | 0.2031 | 0.1758 | 0.1586 | 0.1612 |
| 7 | Intercom | 0.1649 | 0.1840 | 0.1977 | 0.1743 | 0.1588 | 0.1615 |
| 8 | Canva | 0.1635 | 0.1784 | 0.1892 | 0.1791 | 0.1574 | 0.1540 |
| 9 | HubSpot | 0.1614 | 0.1821 | 0.1957 | 0.1754 | 0.1498 | 0.1592 |
| 10 | HubSpot_CRM | 0.1606 | 0.1731 | 0.1827 | 0.1740 | 0.1514 | 0.1563 |
| 11 | Asana | 0.1605 | 0.1770 | 0.1886 | 0.1661 | 0.1586 | 0.1568 |
| 12 | Calendly | 0.1594 | 0.1738 | 0.1841 | 0.1688 | 0.1482 | 0.1613 |
| 13 | Zoom | 0.1592 | 0.1751 | 0.1863 | 0.1707 | 0.1569 | 0.1499 |
| 14 | Netlify | 0.1575 | 0.1719 | 0.1821 | 0.1752 | 0.1532 | 0.1442 |
| 15 | Shopify | 0.1569 | 0.1776 | 0.1910 | 0.1670 | 0.1500 | 0.1537 |
| 16 | Notion | 0.1562 | 0.1747 | 0.1871 | 0.1643 | 0.1518 | 0.1525 |
| 17 | Stripe | 0.1552 | 0.1721 | 0.1841 | 0.1655 | 0.1490 | 0.1511 |
| 18 | Grammarly | 0.1546 | 0.1682 | 0.1786 | 0.1618 | 0.1510 | 0.1509 |
| 19 | Salesforce | 0.1528 | 0.1778 | 0.1937 | 0.1693 | 0.1438 | 0.1452 |
| 20 | CrowdStrike | 0.1503 | 0.1693 | 0.1827 | 0.1599 | 0.1415 | 0.1494 |
| 21 | Klaviyo | 0.1483 | 0.1706 | 0.1862 | 0.1543 | 0.1466 | 0.1439 |
| 22 | Atlassian | 0.1462 | 0.1654 | 0.1792 | 0.1575 | 0.1385 | 0.1427 |
| 23 | Miro | 0.1450 | 0.1561 | 0.1651 | 0.1557 | 0.1377 | 0.1418 |
| 24 | Monday | 0.1449 | 0.1592 | 0.1701 | 0.1536 | 0.1421 | 0.1391 |
| 25 | Dropbox | 0.1438 | 0.1614 | 0.1745 | 0.1574 | 0.1333 | 0.1406 |
| 26 | Netflix | 0.1436 | 0.1661 | 0.1812 | 0.1575 | 0.1362 | 0.1373 |
| 27 | Framer | 0.1423 | 0.1651 | 0.1795 | 0.1596 | 0.1349 | 0.1325 |
| 28 | DocuSign | 0.1419 | 0.1610 | 0.1747 | 0.1542 | 0.1302 | 0.1415 |
| 29 | Snowflake | 0.1416 | 0.1560 | 0.1667 | 0.1498 | 0.1301 | 0.1450 |
| 30 | Datadog | 0.1401 | 0.1562 | 0.1679 | 0.1513 | 0.1348 | 0.1342 |
| 31 | Linear | 0.1391 | 0.1592 | 0.1728 | 0.1489 | 0.1356 | 0.1329 |
| 32 | Box | 0.1375 | 0.1490 | 0.1577 | 0.1526 | 0.1387 | 0.1212 |
| 33 | GitHub | 0.1367 | 0.1607 | 0.1758 | 0.1469 | 0.1395 | 0.1237 |
| 34 | GitLab | 0.1360 | 0.1488 | 0.1581 | 0.1427 | 0.1357 | 0.1294 |
| 35 | Freshworks | 0.1348 | 0.1476 | 0.1577 | 0.1419 | 0.1283 | 0.1344 |
| 36 | Twilio | 0.1347 | 0.1530 | 0.1658 | 0.1415 | 0.1262 | 0.1364 |
| 37 | ServiceNow | 0.1333 | 0.1496 | 0.1613 | 0.1423 | 0.1279 | 0.1298 |
| 38 | Segment | 0.1331 | 0.1492 | 0.1606 | 0.1370 | 0.1263 | 0.1362 |
| 39 | Postman | 0.1301 | 0.1453 | 0.1560 | 0.1410 | 0.1253 | 0.1241 |
| 40 | Vercel | 0.1296 | 0.1410 | 0.1506 | 0.1412 | 0.1214 | 0.1262 |
| 41 | Okta | 0.1290 | 0.1464 | 0.1591 | 0.1401 | 0.1216 | 0.1253 |
| 42 | Adobe_CreativeCloud | 0.1266 | 0.1430 | 0.1546 | 0.1397 | 0.1217 | 0.1185 |
| 43 | Semrush | 0.1173 | 0.1312 | 0.1415 | 0.1284 | 0.1140 | 0.1094 |
| 44 | Zendesk | 0.1141 | 0.1272 | 0.1369 | 0.1223 | 0.1111 | 0.1088 |
| 45 | Hotjar | 0.1123 | 0.1239 | 0.1338 | 0.1272 | 0.1052 | 0.1045 |
| 46 | Hootsuite | 0.1027 | 0.1174 | 0.1283 | 0.1133 | 0.0952 | 0.0998 |
| 47 | Mailchimp | 0.1010 | 0.1190 | 0.1328 | 0.1081 | 0.0950 | 0.1000 |
| 48 | ClickUp | 0.0982 | 0.1075 | 0.1151 | 0.1081 | 0.0909 | 0.0955 |
📐 The F-Pattern in SaaS Landing Pages
Eye-tracking research shows users scan landing pages in an F-pattern:
- First horizontal: Read headline left-to-right (Zone A — Hero Headline)
- Second horizontal: Scan subheadline/CTA area (Zone C — CTA Button)
- Vertical: Scan down left side for key info (Zone B — Product Visual)
Top performers optimize for this: Headline in top-left → CTA below headline → Product visual on right → Social proof below
🏅 Design Patterns That Win
Product-First Hero
Used by: Airtable, Figma, Notion, Miro
Large product screenshot dominates right side with short headline on left. CTA below headline.
Bold Statement Hero
Used by: Webflow, Vercel, Linear
Minimal text, big headline, dark background with bright accents. Single prominent CTA.
Trust-First Hero
Used by: Slack, HubSpot, Salesforce
Headline + subheadline with customer logos prominently displayed. Multiple CTAs (trial + demo).
Video-First Hero
Used by: Wistia, Zoom, Netflix
Video player or animation in hero section. Play button as focal point. Minimal text overlay.